L&D reporting software & training analytics dashboards

Bring course, ILT, coaching, and credential activity into role-based reporting views for L&D leaders, managers, and administrators.

What is L&D reporting software?

L&D reporting software turns learning and training records into dashboards and reports for completion, attendance, learner activity, certification status, training costs, and program trends.

It helps L&D teams answer operational and leadership questions from one reporting layer instead of manually combining exports. With Trainery, track completions, attendance, learner activity, certification status, and training costs from a connected reporting layer.

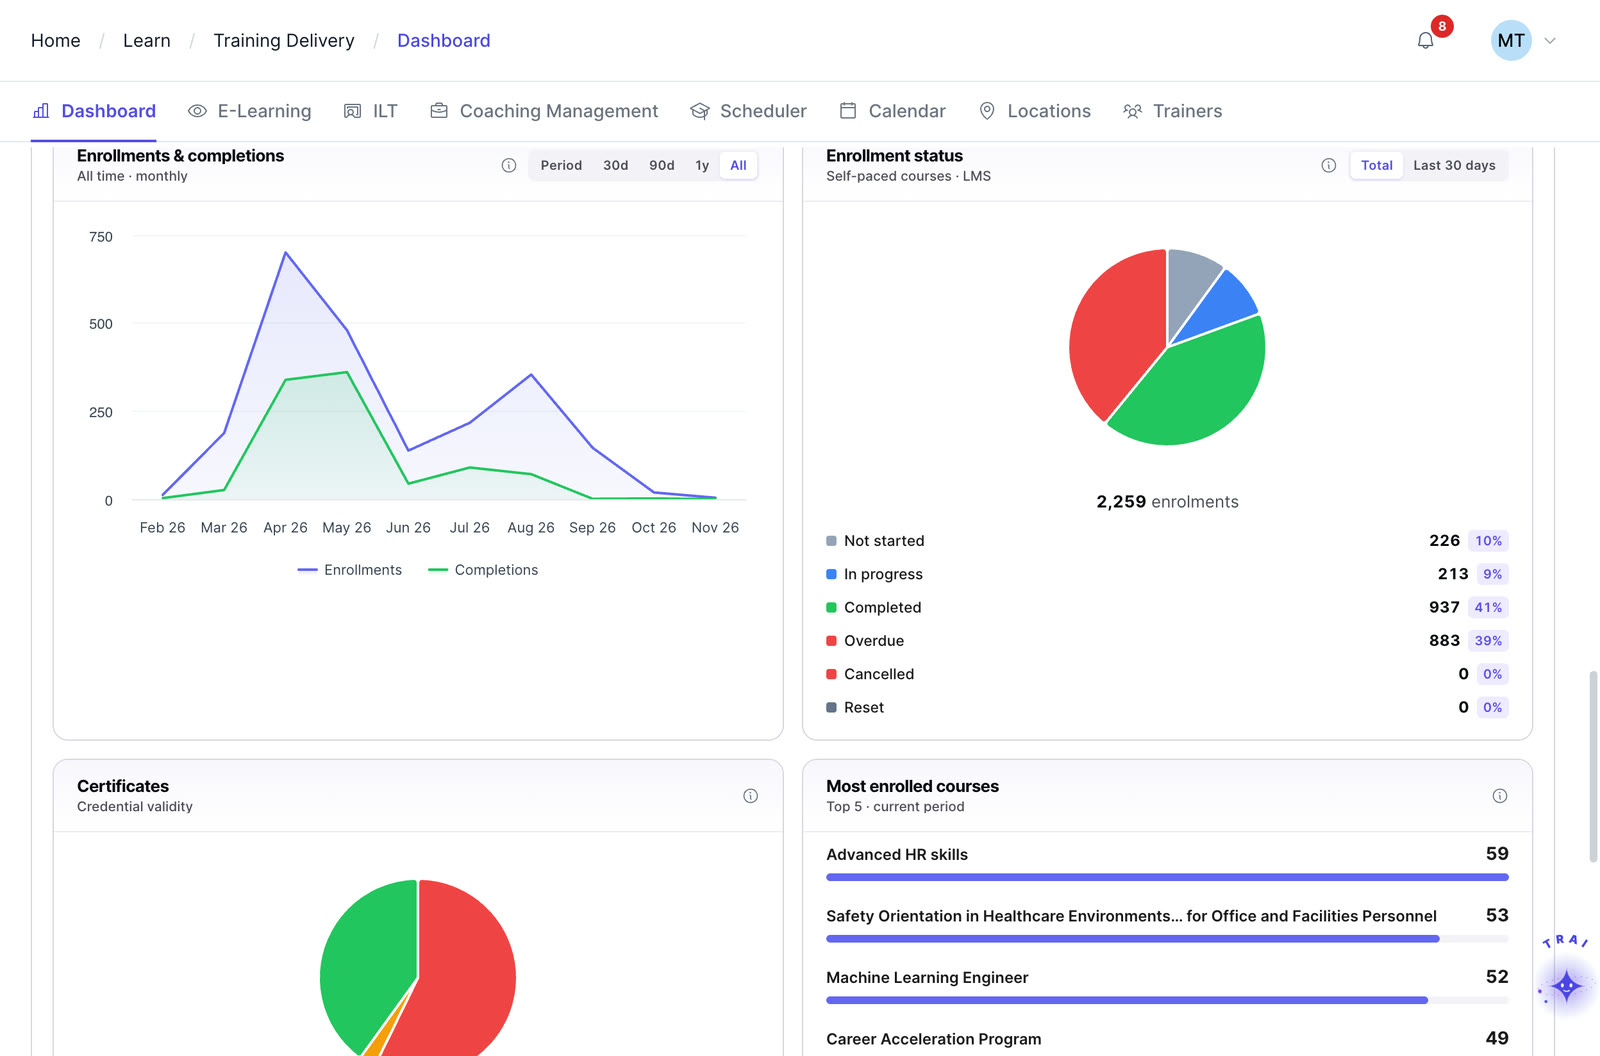
Enrolments and completions over time, enrolment status and most-enrolled courses in Trainery

Illustrative L&D dashboard views

Use role-scoped dashboard views to monitor learning, training operations, coaching, and credential activity. Configure the view around the metrics and audiences your team needs.

Illustrative dashboard dataNames, counts, percentages, costs, and ROI values shown in the dashboard examples below are sample interface data for demonstration only. They are not customer results, benchmarks, or guaranteed outcomes.

Learn Dashboard

ILT attendance rate
Across all sessions0%
Total sessions
Total ILT sessions scheduled24
Top learners
  • 1. Sarah M87%
  • 2. James R82%
  • 3. Priya K75%
  • 4. Carlos D68%
Learning usage metrics
  • Active learners142
  • Avg progress68%
  • Completed89
  • Completion rate74%
Active learners
  • Active 30d128
  • Active 7d47
  • Active rate91%
Learning hours
  • Avg hours4.2h
  • Per learner12.7h
  • Enrollments312
Completion trend
Investment
  • Investment$42K
  • Cost/learner$138

Everything L&D leaders need to measure, prove, and improve

Training cost & investment reporting

Track training spend and operational cost measures such as cost per learner or cost per session where those inputs are available. Use learning and performance data together to support ROI analysis while keeping financial conclusions tied to your organization’s own methodology and evidence.

  • Cost-per-learner & cost-per-session
  • Branch-level investment breakdown
  • Support learning-to-performance analysis
  • Exportable for finance & exec reporting
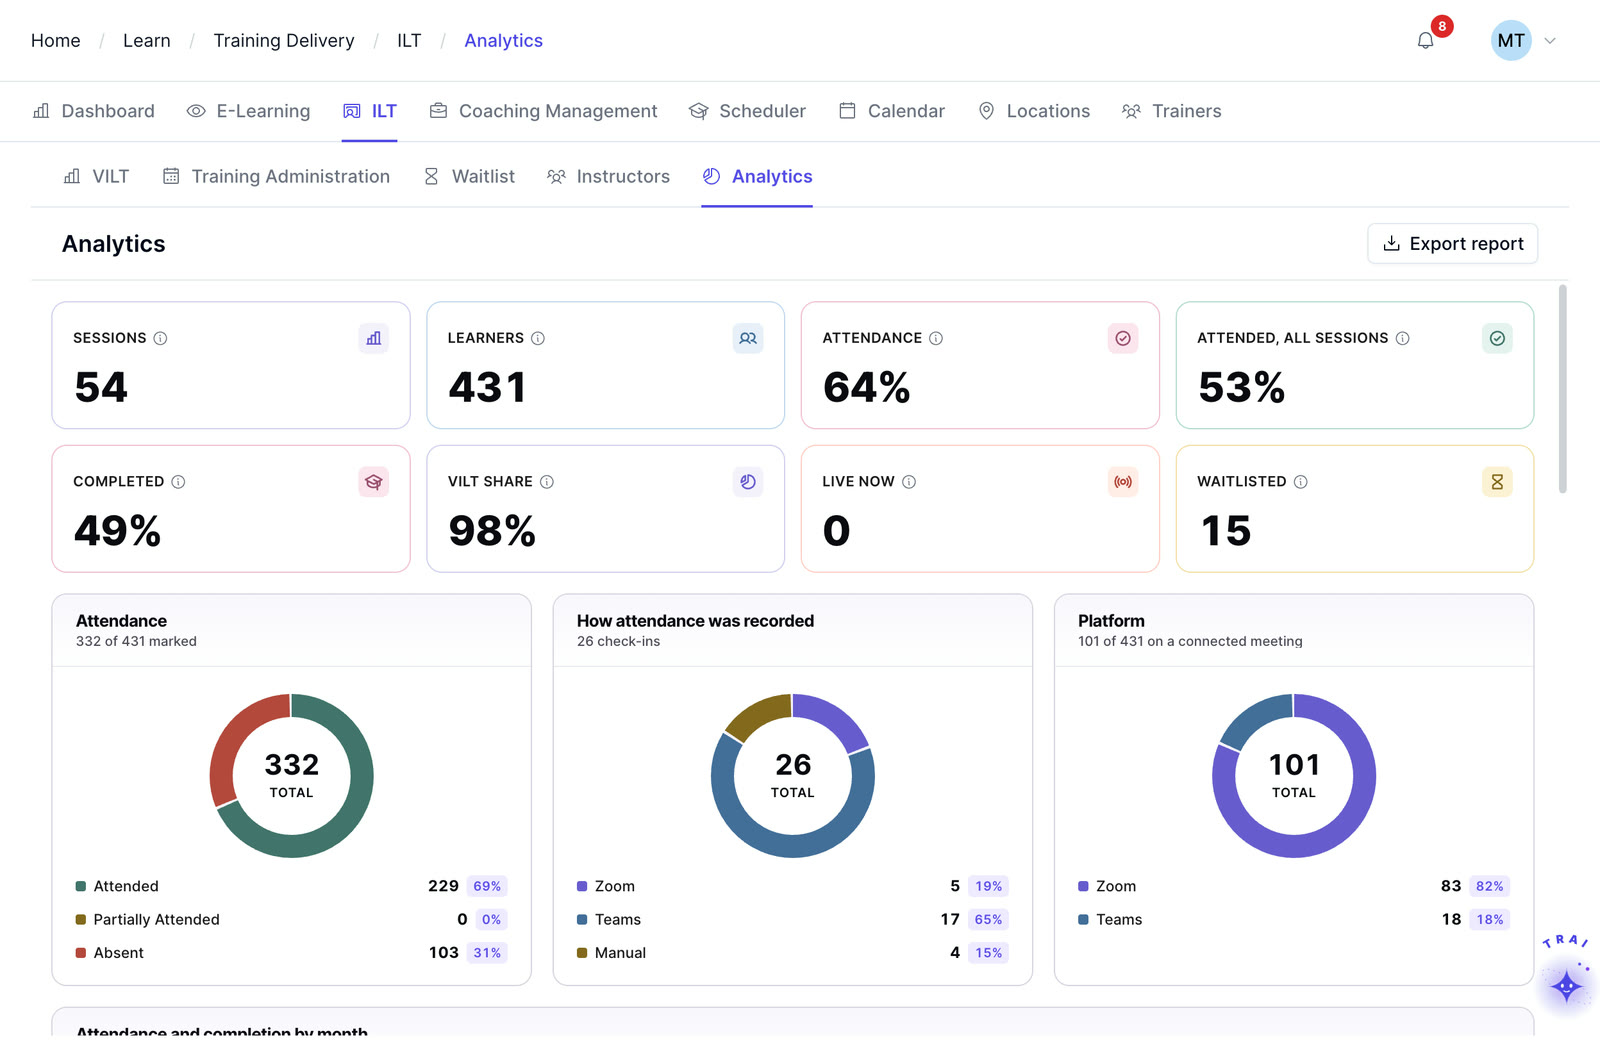
Instructor-led training analytics in Trainery: sessions, learners, attendance and platforms

Learner & engagement analytics

Track active learner rate (7-day and 30-day), enrollment volume, completion rates, average progress, time spent, and top performers by branch or department.

  • Active learner rate (7d & 30d windows)
  • Completion rate trend over time
  • Top learner leaderboard by branch
  • Avg hours per learner & enrollment

Widget-based customization

Add, remove, and rearrange available widgets to configure dashboards around metrics, trends, tables, charts, and investment views relevant to each audience.

  • Drag-and-drop widget layout
  • Configurable reporting widgets
  • Role-tagged widget visibility
  • Share dashboards with team members

Overall + sub-module dashboards

One master dashboard for a bird’s-eye view of all learning. Plus dedicated sub-dashboards for each module, LMS, ILT and virtual training, Coaching, Credentials, and Customer Training, each scoped to role.

  • Master cross-module overview
  • Dedicated per-module dashboards
  • Role-scoped views (Admin, Manager, Learner)
  • Shareable & personal dashboards
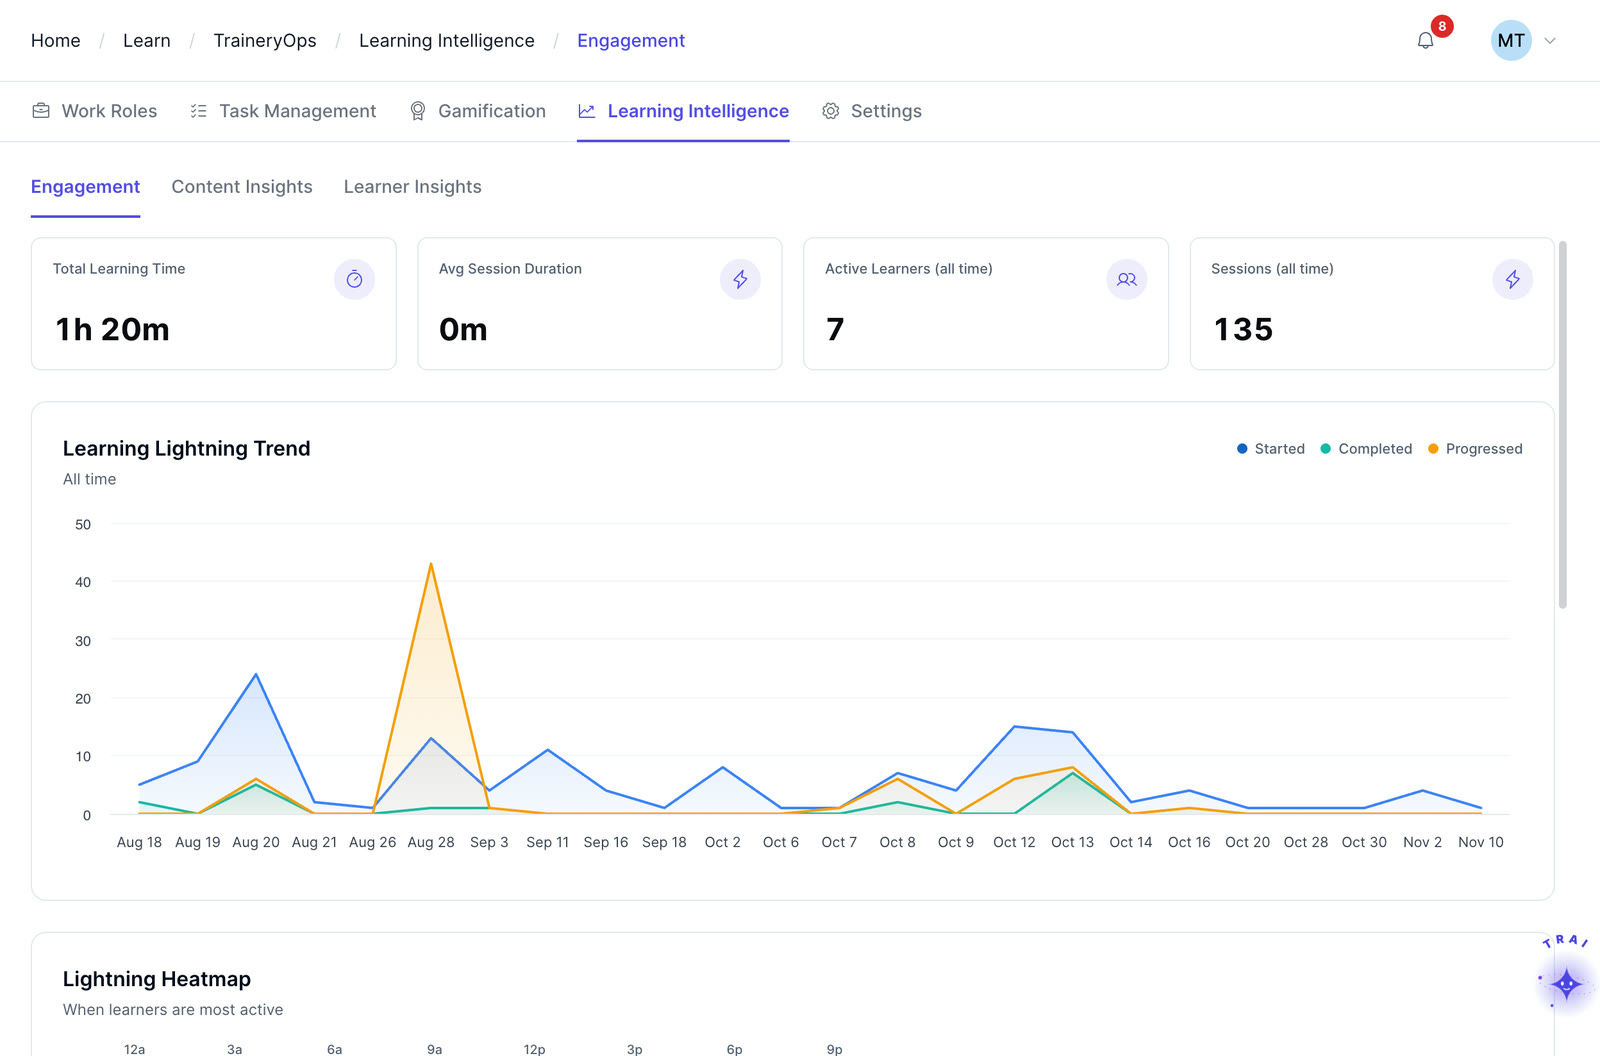
Learning intelligence in Trainery: learning time, active learners and activity over time

Answer leadership questions without manual reconciliation

When leadership asks what was spent, who completed training, where gaps remain, or how activity is trending, L&D teams need consistent records across systems.

A shared reporting layer can bring training cost, completion, attendance, and credential status into the same analysis so teams spend less time reconciling exports and more time validating the result.

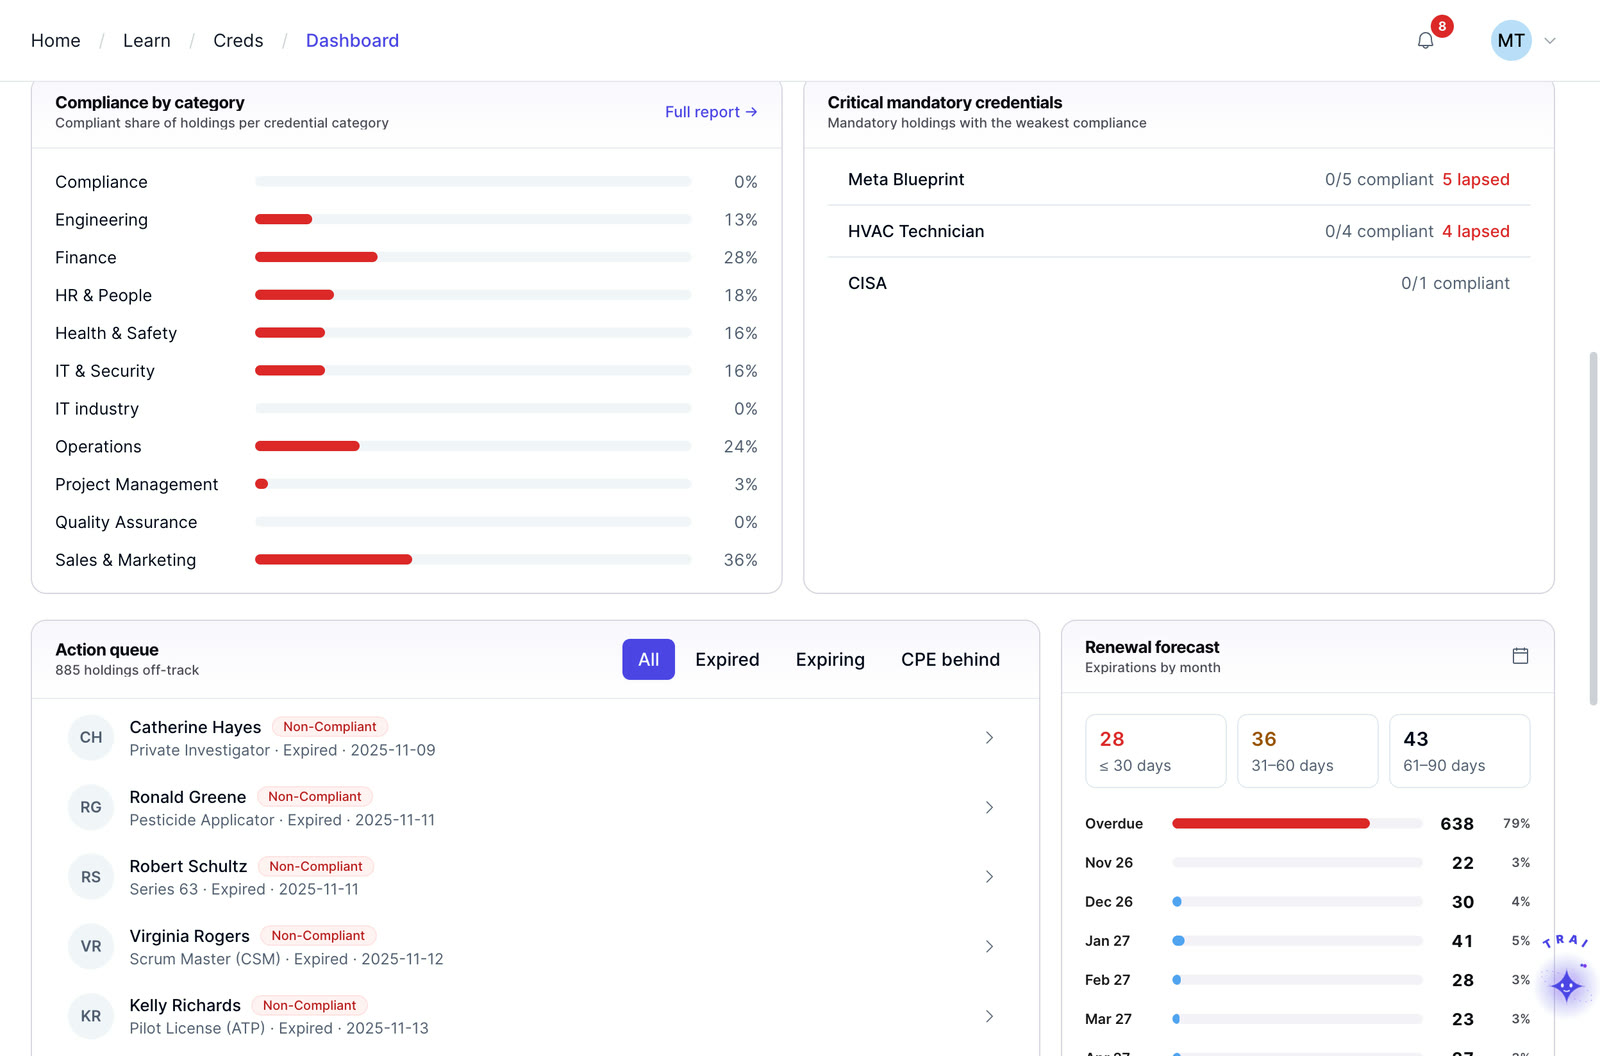
Credential compliance by category, the action queue and the renewal forecast at 30, 60 and 90 days

Frequently asked questions

What the dashboards show, who can see them, and how reporting data can be shared and exported.

What does the Trainery analytics dashboard actually show?

The Learn Dashboard gives a unified view across active Trainery learning modules, including course completions, ILT session attendance and participation, coaching progress, and credential coverage. Role-scoped views help different audiences focus on the data relevant to them.

Can I create separate dashboards for different audiences: execs, managers, and admins?

Trainery supports role-scoped reporting views for different audiences. The exact dashboard configuration and sharing workflow should be confirmed for the roles and reporting requirements in scope.

Can Trainery report on training costs and ROI inputs?

Trainery reporting can surface training cost measures such as total spend, cost per learner, and cost per session when those inputs are captured. ROI should be calculated using your organization’s own methodology and evidence; learning activity and performance data can support that analysis rather than presenting an automatic ROI figure as proof of business impact.

What types of L&D reports can Trainery support?

Reporting can cover learner activity, completion status, assessment results, ILT attendance, training operations, credential status, and cost-related measures. Available dashboards and report configuration should be validated against the Trainery modules and reporting requirements in scope.

Can Trainery reports be shared with different stakeholders?

Role-scoped dashboards and reporting outputs can support different audiences such as L&D administrators, managers, executives, HR, and finance. During evaluation, confirm the exact sharing, export, and scheduling workflow your organization requires.

How current is the data in Trainery dashboards?

Dashboard freshness depends on the source module and metric being viewed. Current operational status and historical trends can have different update behavior, so teams should validate refresh timing for critical completion, attendance, credential, compliance, and cost reports during implementation.

Can Trainery reporting data be used with external BI tools?

Trainery can support structured reporting and data-export workflows. If your organization needs Power BI, Tableau, a data warehouse, or a specific API workflow, confirm the required fields, refresh cadence, and delivery method during solution scoping rather than assuming every BI connection is native.

See the dashboard live

Book a demo to review the reporting views, filters, and metrics relevant to your course, ILT, coaching, credential, and compliance workflows.